[UPDATE APRIL 2022: v2 of the Search Console Explorer Studio is now live. v1 remains available below.]
A few months ago I launched the Search Console Explorer for Google Sheets and it went down a storm! It’s had incredible feedback and engagement on Twitter and whilst the tracking within Sheets is far from perfect, the numbers are still staggering. On February 10th it peaked at 3.8k users in a single day! Suffice to say, it’s been my most popular tool yet.
I have been promising a Data Studio version for a while now and I’m finally releasing V1. Introducing the Search Console Explorer Studio!
Is this the same as the Google Sheets version? No.
This dashboard offers different ways to explore (and extract) your Google Search Console data and Google Data Studio’s Interactions really brings this to life.
Whether you’re clicking on a query, location or device, you can truly ‘explore’ your data!
For example, you can toggle between devices to visually compare mobile vs desktop positions and their respective metrics, or compare UK to USA in the same way.
Let’s take a look:
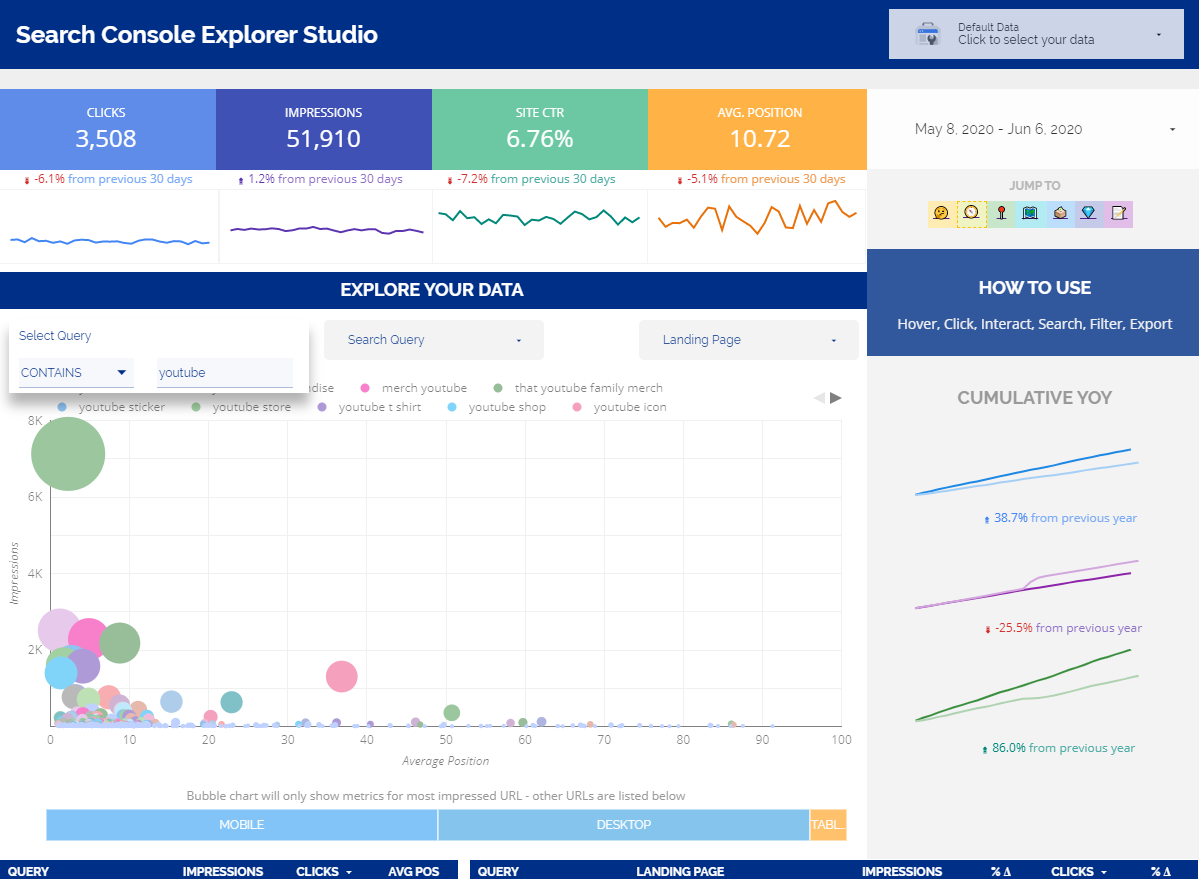
Search Console Explorer Studio
Example page with YOY cumulative (filtered to contains ‘youtube’)
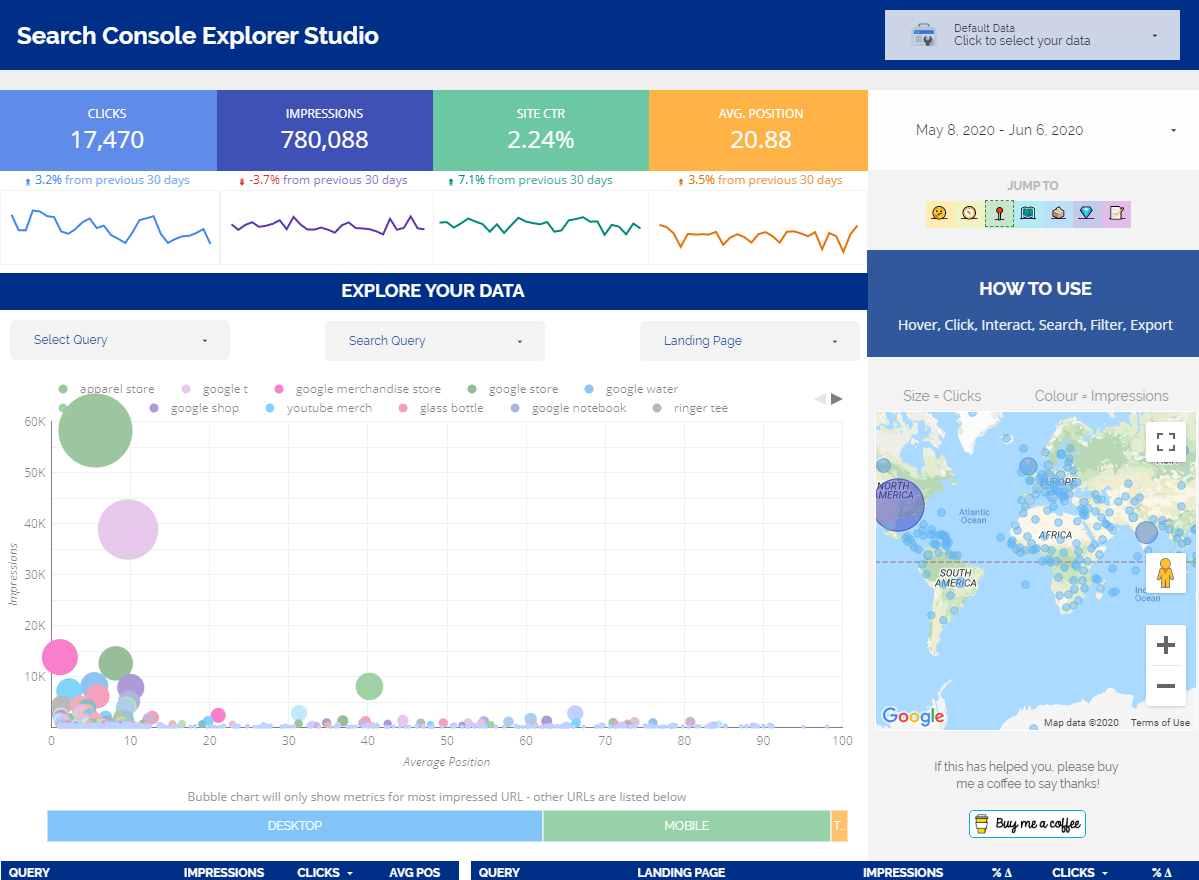
Example page with Google Map
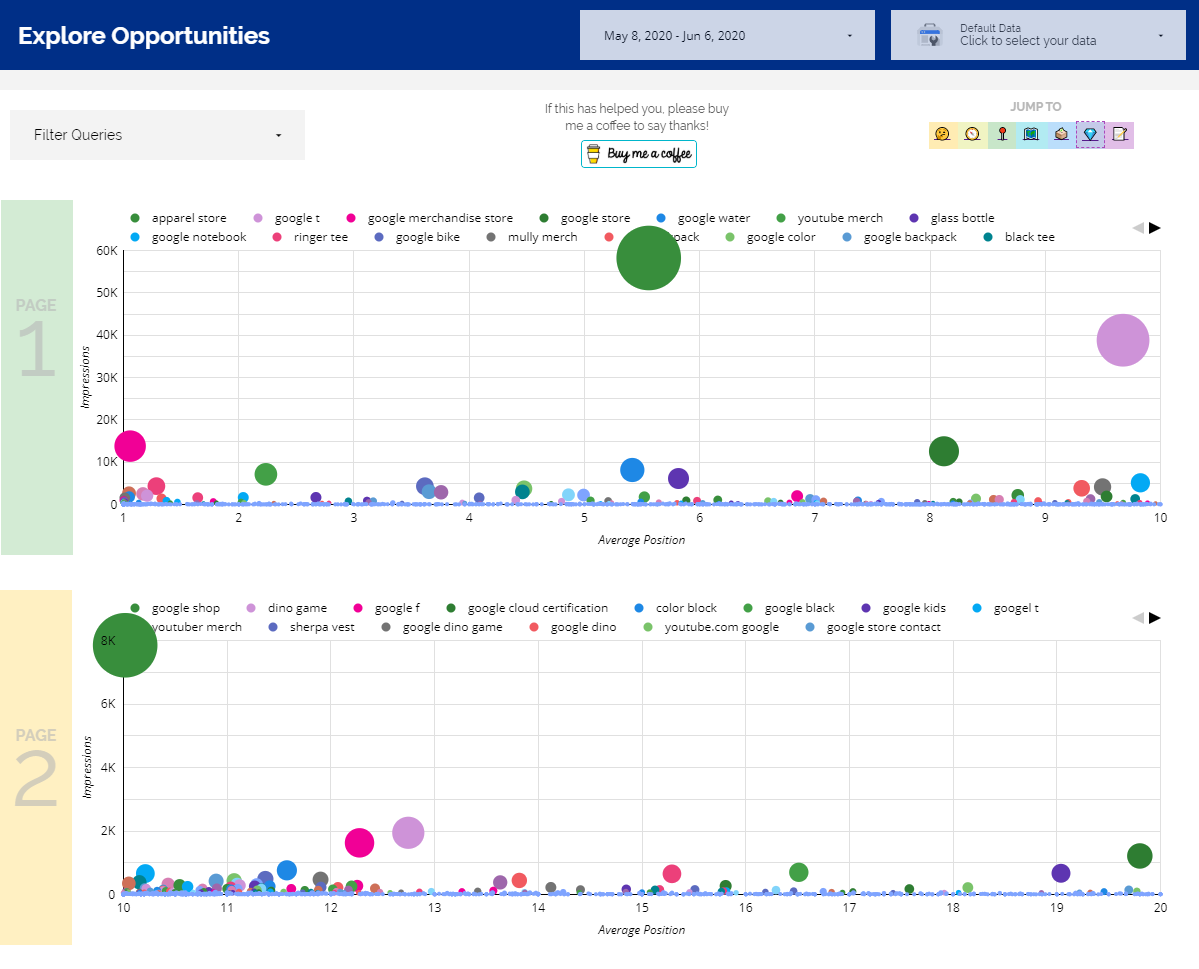
Example page with Opportunities
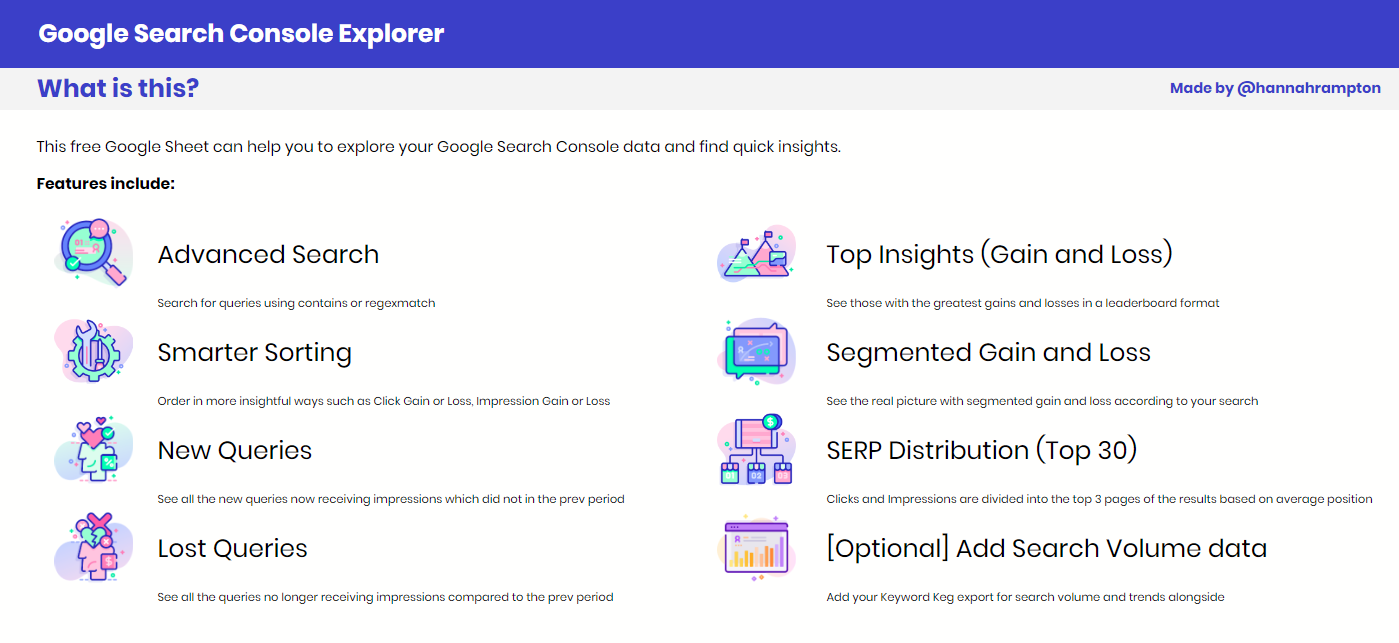
Features include:
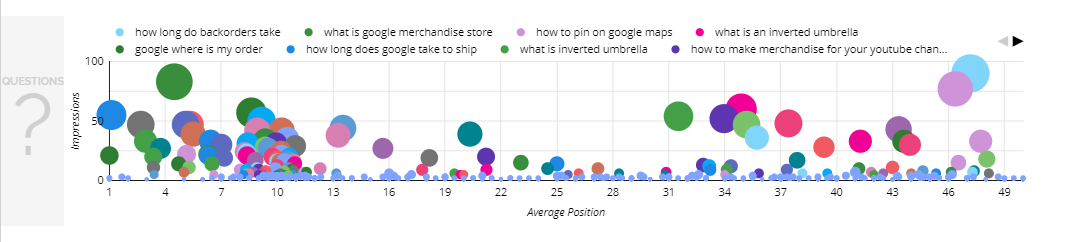
– Visual Exploration of your Search Console Data:
Bubble charts are brilliant. They are especially brilliant for showing average position vs impressions. The closer to the left the higher the rank, and the higher and bigger the bubble the greater the impressions. You can see how many impressions you are getting relative to the current average position.
– Advanced Search:
Search for queries using contains, starts with, regexp, etc. Doing so affects the data visualisations and you can further refine and interact. You can exclude using custom filters in the same way as the brand filters are applied (see ‘Custom Filters’).
– YOY Cumulative Trends
The year on year cumulative trends will filter according to your refinements and interactions with the data, whether thats a single query, a contains match or device refinement. The YOY cumulative trends offer a simple overview on performance vs last year.
– Explore and Isolate by Location (interaction):
As you filter the search queries, the maps (Geo and Google) will update to show the geographical distribution. You can hover over the data points for more information or click to refine the data.
– Explore and Isolate by Device (interaction):
Much like the above for location, you can also see the device distribution within each view. Hover for more insight or click to refine. This is especially helpful for seeing average position for Desktop vs Mobile – just click between the devices to isolate, or isolate by a search query and hover over the devices.
– See multiple URLs impressed:
By interacting with a search query and isolating this, all URLs impressed will be shown on the right table. This can help you to see areas of potential cannibalisation and export the related data if needed.
– Custom filters (Brand and Non-Brand)
Two custom filters have been added to establish a brand and non-brand split. These can be replicated for any other filters you want to apply. Guidance on how to update these are included in the Notes and Resources page.
– Comparison period:
With the date selector you can override the default dates and comparison periods. The absolute change value is shown for both clicks and impressions.
– Opportunity by SERP:
Using previously exclaimed bubble charts, the opportunity page visualises the opportunities using average position and impressions which are then split across ‘pages’ 1, 2 and 3 of the SERPs.
We no longer have a set ’10’ results per SERP but it was a clear divide for easier analysis.
– Questions:
As part of the opportunities page, questions have also been isolated so you can see the types of queries you are being shown for which you could potentially satisfy. This view is set to average position 1 – 50 as default but if you need to look even further, update the chart to show average position 1 – 100.
Examples in Action
Example of Isolating by Location
Filtering Opportunities
In the example below we filter for contains. To match to youtube OR google we can use regexp. Example: .*youtube.*|.*google.*
Tip! If you have configured the Brand and Non-Brand filters, you can apply these to the charts!
You can also see Questions in the same way
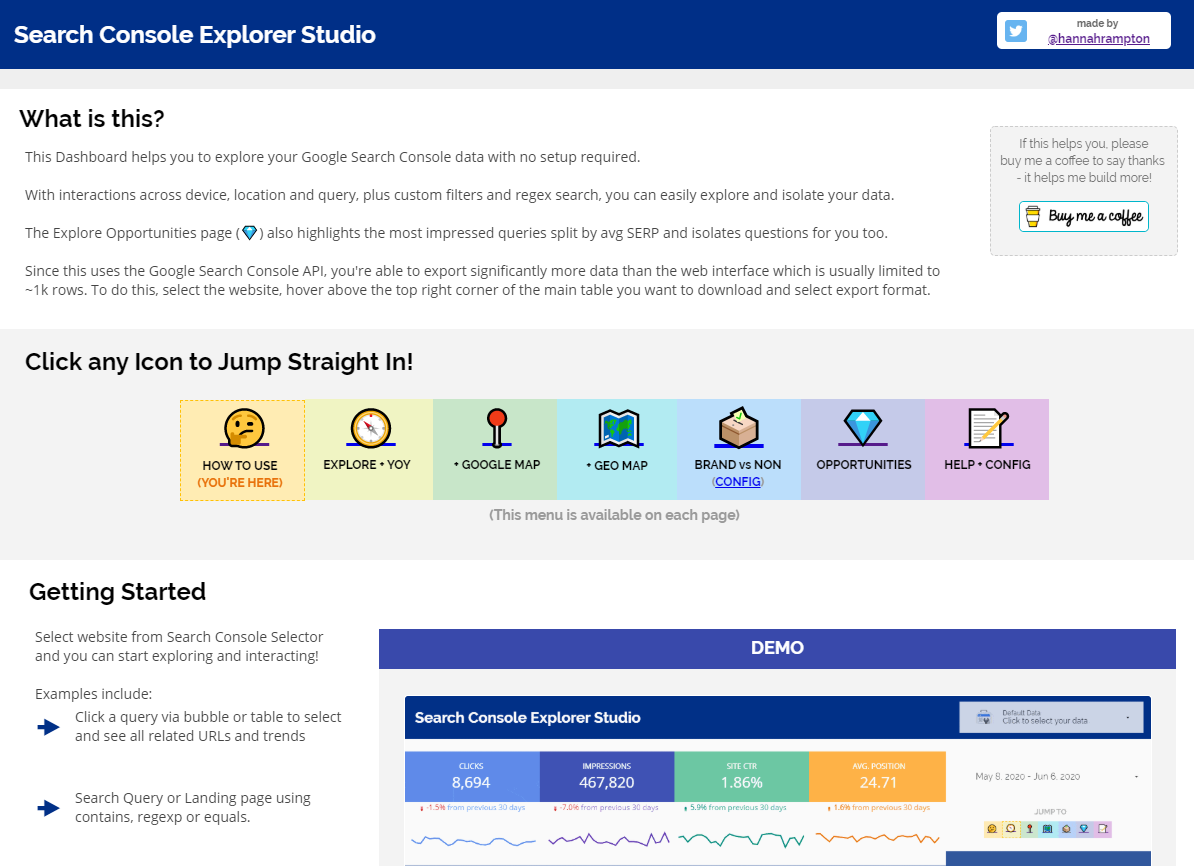
How Do I Use It?
It’s all in there! As much as I enjoy traffic to my website, rather than detail any guidance around setup and use here I have included it within the tool. Page 1 is the main ‘Getting Started’ page and there is more guidance on ‘Notes and Resources’.
There is even an animated demo to help you get familiar with the ways you can interact:
Quick jump menu
As shown in the example above, a quick jump menu has been included on each page to help you move about more easily.
Plug and Play by design!
It’s built to be plug and play so once you have made a copy, you can select your website from the Google Search Console selector and it will come to life.
If you want to customise further, you can add your own datasource directly (best done on copy so all charts switchover seamlessly)
Go to the Search Console Explorer Studio
To download your own copy, click the link below.
https://hanr.link/SCE-Studio-v1
If you’re a regular user, I recommend bookmarking the link so you can make future copies without needing to come back here (Hey, come back if you want!).
Say Thanks by Sharing!
All social shares and tags are appreciated!
If this dashboard has helped you in any way please consider buying me a coffee!
What’s Next?
Check back soon or follow me on Twitter to stay up to date on my latest tools and dashboards!
Where is the Google Sheets version?
You can find the Google Sheets version of the Search Console Explorer here.